


To group rows in Excel, select the row numbers you want to organize, open the Data tab, and click Group in the Outline section. Excel adds plus (+) and minus (−) buttons that let you collapse or expand the selected rows without deleting their contents.
You can also group multiple sections, create nested groups, use keyboard shortcuts, and remove grouping whenever you need to. Here’s how each method works.
Quick Answer: How to Group Rows in Excel
Follow these six steps to group rows in Microsoft Excel:
- Open your Excel worksheet.
- Select the row numbers you want to group.
- Click the Data tab.
- Find the Outline section and choose Group.
- Select Rows if a dialog box appears.
- Click the minus (−) button to collapse the rows or the plus (+) button to expand them.
For example, if rows 2 through 4 contain monthly sales figures, grouping them creates a collapsible section. You can hide those details while keeping a quarterly total visible in row 5.
What Does Grouping Rows Mean in Excel?
Grouping rows is an Excel Outline feature that organizes related rows into expandable and collapsible sections.
It’s especially useful for financial statements, sales reports, project schedules, and worksheets containing detailed information beneath summary rows.
Consider this monthly sales report:
| Row | Month | Sales |
|---|---|---|
| 1 | Month | Sales |
| 2 | January | $1,250 |
| 3 | February | $1,500 |
| 4 | March | $1,750 |
| 5 | Q1 Total | $4,500 |
| 6 | April | $1,800 |
| 7 | May | $2,100 |
| 8 | June | $2,400 |
| 9 | Q2 Total | $6,300 |
| 10 | Grand Total | $10,800 |
You can group rows 2–4 and 6–8 separately. When those groups collapse, the quarterly totals remain visible.
Grouping doesn’t delete data, change cell values, or automatically calculate totals. It simply controls how much information appears on the worksheet.
Method 1: Group Rows Using the Data Tab
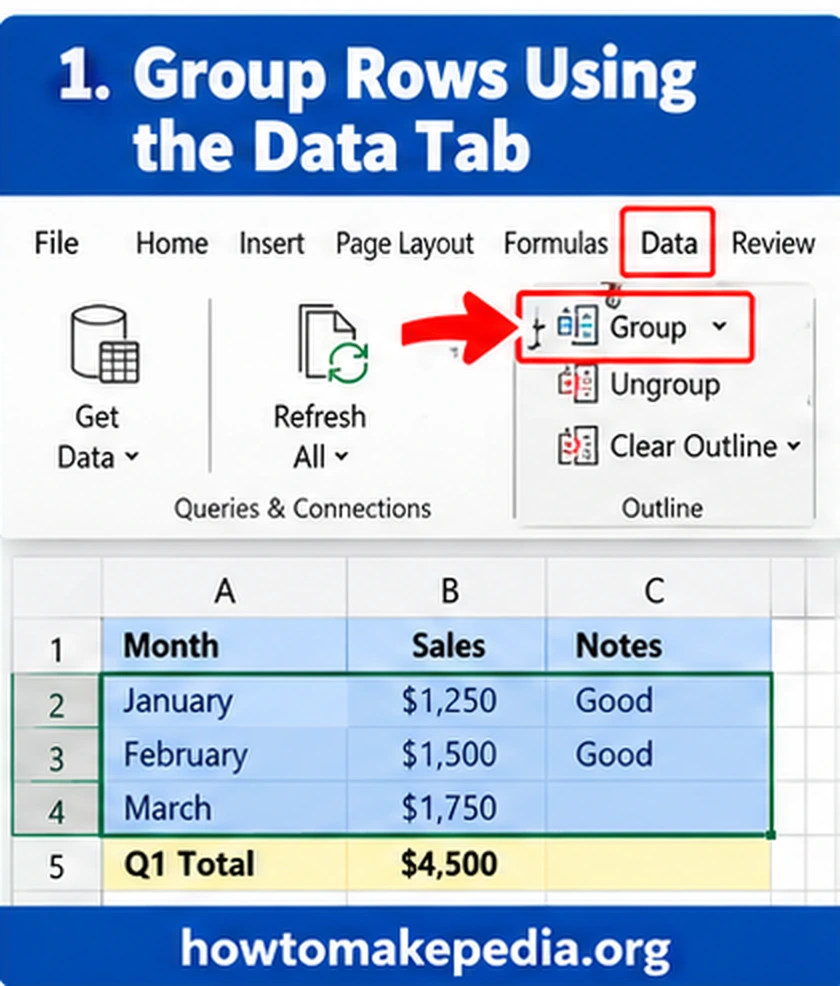
The Data tab offers the easiest way to group Excel rows without remembering keyboard shortcuts.
Step 1: Select the Rows
Open your worksheet and identify the rows containing related information.
Using the sales example, click row number 2, hold Shift, and click row number 4.
This selects three complete rows.
Don’t include row 5 if you want the Q1 Total to remain visible after collapsing the monthly details.
Step 2: Open the Data Tab
Click Data on the Excel Ribbon.
Look for the Outline section, which contains commands for grouping and ungrouping worksheet information.
Step 3: Click Group
Select Group.
If Excel asks whether you want to group rows or columns, choose Rows and confirm.
When you select entire rows, supported desktop versions usually create the group without displaying this dialog box.
Step 4: Find the Grouping Controls
Excel displays an outline bracket next to the selected row numbers.
A small minus (−) button indicates that the group is expanded.
Step 5: Collapse the Rows
Click the minus button.
Rows 2, 3, and 4 disappear from view, while the Q1 Total in row 5 remains visible.
Step 6: Expand the Rows Again
Click the plus (+) button beside the collapsed section.
Excel displays all three monthly rows again, including their original values and formulas.
You can expand and collapse the same group as often as needed.
Method 2: Group Rows Using a Keyboard Shortcut
Keyboard shortcuts can make grouping faster when you’re working with large reports.
| Action | Windows | Mac |
|---|---|---|
| Group rows | Alt + Shift + Right Arrow | Command + Shift + K |
| Ungroup rows | Alt + Shift + Left Arrow | Command + Shift + J |
How to Use the Shortcut
- Select the complete rows you want to group.
- Press the appropriate keyboard shortcut.
- Choose Rows if Excel displays a grouping dialog.
- Check that the outline bracket appears beside the selected rows.
On Windows, pressing Alt + Shift + Right Arrow creates a group. To remove it, select the grouped rows and press Alt + Shift + Left Arrow.
These shortcuts create or remove groups; they are different from shortcuts that expand or collapse existing groups.
How to Collapse and Expand Grouped Rows in Excel

Excel provides several ways to control grouped information.
Using plus and minus buttons: Click minus (−) to hide the details inside a group. Click plus (+) to display them again.
Using outline level numbers: Small numbered buttons appear near the upper-left side of a grouped worksheet.
- Level 1 shows the broadest summary.
- Level 2 reveals an additional level of information.
- Level 3 reveals more details when a third level exists.
A worksheet with only one grouping layer usually displays two levels.
On supported Windows versions, you can also use Alt + Shift + = to expand outlined details and Alt + Shift + – to collapse them.
Keyboard layouts and the current selection can affect how these shortcuts work.
How to Group Multiple Separate Rows in Excel
You can create several independent row groups in the same worksheet.
Using the monthly sales report, create separate groups for the first and second quarters.
Group the First Quarter
- Select rows 2–4.
- Open Data > Group.
- Confirm that the first outline bracket appears.
Group the Second Quarter
- Select rows 6–8.
- Open Data > Group again.
- Confirm that Excel creates another outline bracket.
Now you have two independent groups.
You can collapse January through March while keeping April through June expanded, or collapse both groups to display only their totals.
Create each group separately rather than relying on one disconnected selection.
How to Create Nested Row Groups in Excel
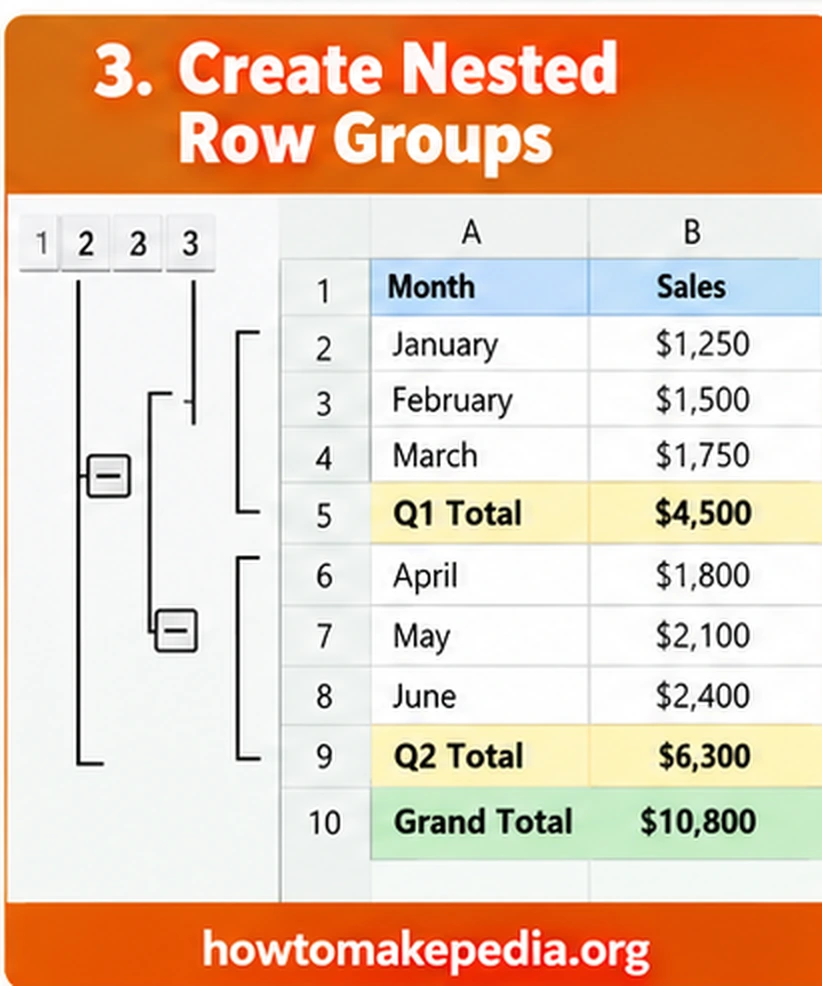
Nested groups are useful when a report contains several layers of information.
For example, you might want to display monthly sales, quarterly totals, or only the grand total.
Follow these steps using the same worksheet:
- Make sure all rows are expanded.
- Select rows 2–9.
- Click Data > Group to create the outer group.
- Select rows 2–4 and create an inner group.
- Select rows 6–8 and create another inner group.
- Examine the outline level numbers and test the collapse buttons.
The grand total in row 10 stays outside the outer group.
With this arrangement:
| Outline Level | Visible Information |
|---|---|
| Level 1 | Grand Total |
| Level 2 | Q1 Total, Q2 Total, and Grand Total |
| Level 3 | Monthly details and all totals |
This structure lets you switch between a detailed sales report and a compact summary.
Excel supports up to eight outline levels, although most everyday reports need only two or three.
How to Group Rows Automatically Using Auto Outline
Excel can sometimes build an outline automatically when your worksheet contains properly organized summary formulas.
Steps to Use Auto Outline
- Arrange the data with consistent detail rows and summary formulas.
- Select a cell inside the report.
- Open the Data tab.
- Open the Group menu in the Outline section.
- Select Auto Outline, where available.
- Review the groups Excel creates.
For the monthly sales example, the quarterly formulas help Excel identify which rows belong together.
Auto Outline works best when related data is organized consistently.
It doesn’t automatically group an arbitrary list of customers, products, or employees just because they share a category name.
If the result isn’t useful, remove the outline and create the groups manually.
How to Group Rows by Category in Excel
Suppose your worksheet contains sales records from the East, West, and Central regions.
You may want separate expandable sections for each region.
A practical approach is to organize the records before grouping.
- Save a backup of the worksheet.
- Sort the records by Region, keeping entire records together.
- Check that each region’s records are in consecutive rows.
- Add summary rows if necessary.
- Select each region’s detail rows.
- Create a separate group for each region.
- Verify that totals still match the underlying records.
For some reports, Excel’s Subtotal command can insert summary formulas and build an outline automatically.
However, the Subtotal command isn’t available directly inside an Excel Table. Converting a Table to a normal range removes its structured-table behavior, so consider the consequences before doing that.
If you primarily need to view records matching particular categories, filtering or a PivotTable may be more appropriate than row grouping.
How to Ungroup Rows in Excel
Ungrouping removes the collapsible structure while keeping the original worksheet data.
Follow these steps:
- Expand the group if possible.
- Select the grouped rows.
- Open the Data tab.
- Click Ungroup in the Outline section.
- Choose Rows if prompted.
- Confirm that the outline bracket disappears.
You can also use Alt + Shift + Left Arrow on Windows or Command + Shift + J on Mac.
Ungrouping doesn’t delete the cells, values, or formulas.
How to Remove All Row Grouping Using Clear Outline

If your worksheet contains multiple groups or nested sections, removing them individually can be inconvenient.
Instead, use Clear Outline.
- Expand all grouped rows first.
- Open the Data tab.
- Find the Outline section.
- Open the Ungroup menu.
- Choose Clear Outline.
Excel removes the worksheet’s outline structure.
Ungroup removes selected grouping, while Clear Outline removes the outline across the worksheet.
Neither command deletes your underlying data.
Sometimes rows remain hidden after an outline is removed.
This usually happens when the grouped details were collapsed before you removed their grouping.
To restore them:
- Identify the missing row numbers.
- Select the row headers immediately above and below the hidden rows.
- Open Home > Format.
- Choose Hide & Unhide.
- Click Unhide Rows.
Your hidden rows should reappear.
Remember that removing an outline and making previously hidden rows visible are separate operations.
Group Rows vs. Hide Rows vs. Filter Rows
Grouping, hiding, and filtering all change what you see in Excel, but they serve different purposes.
| Method | Purpose | How to Restore | Best Use |
|---|---|---|---|
| Group Rows | Creates collapsible sections | Click plus (+) | Reports with summary rows |
| Hide Rows | Conceals selected rows | Unhide Rows | Temporarily hiding information |
| Filter Rows | Shows matching records | Clear Filter | Finding data by status, value, or date |
Grouping works best when you want repeatable, expandable report sections.
If you only need to temporarily conceal certain rows, our guide on how to hide rows in Excel explains the simpler method.
Filtering is generally better when the rows you want to see depend on changing criteria rather than fixed worksheet sections.
Does Grouping Rows Affect Excel Formulas?
Grouping rows doesn’t change the underlying cell values or remove them from ordinary SUM calculations.
In the monthly sales example, cell B5 contains:
=SUM(B2:B4)
This adds the first three months:
$1,250 + $1,500 + $1,750 = $4,500.
Even when rows 2–4 are collapsed, the Q1 Total remains $4,500.
Similarly, cell B9 can contain:
=SUM(B6:B8)
The result is $6,300.
The grand total in B10 can use:
=SUM(B5,B9)
This produces $10,800.
If you’re unfamiliar with these formulas, our step-by-step guide on how to sum in Excel explains basic addition and other useful totaling methods.
SUM vs. SUBTOTAL
The SUM function includes values from rows even when those rows are hidden.
The SUBTOTAL function offers additional control over calculations involving filtered or manually hidden rows.
For instance, SUBTOTAL(109,B2:B8) excludes manually hidden rows from its calculation, while function number 9 includes manually hidden rows but excludes filtered-out rows.
Use the appropriate function for the intended report. Don’t exclude collapsed details when your quarterly total is supposed to include every month.
How to Group Rows in Excel on Mac
Excel for Mac also supports worksheet row grouping.
To create a group:
- Select the row numbers you want to organize.
- Click Data on the Ribbon.
- Choose Group.
- Use the outline controls to collapse or expand your rows.
For a faster method, select the desired rows and press Command + Shift + K.
To ungroup them, press Command + Shift + J.
The general grouping workflow is similar to Windows, but Windows-specific Ribbon shortcuts should not be assumed to work on Mac.
How to Group Rows in Excel Online
Excel for the web supports grouping and outlining.
- Open your workbook in Excel Online.
- Select the rows you want to group.
- Choose Data > Outline > Group.
- Select Rows when prompted.
- Use the plus and minus buttons to expand or collapse the section.
The web version supports nested outlines, although some desktop options for styling or positioning summary rows aren’t available.
Menu layouts can vary slightly depending on the Excel interface.
Why Can’t I Group Rows in Excel?
If grouping doesn’t work, check these common problems.
Check whether the worksheet is protected or the workbook has restrictions. Also confirm that you have selected an appropriate range.
2. The Worksheet Is Protected
Worksheet protection can prevent grouping changes. If you have permission, review the protection settings before editing the outline.
In supported Windows desktop versions, open:
File > Options > Advanced
Under the worksheet display options, enable Show outline symbols if an outline is applied.
4. Auto Outline Doesn’t Create Groups
Check that the worksheet has appropriate summary formulas and a consistent data structure. Otherwise, create groups manually.
5. You’re Working Inside an Excel Table
The Subtotal command is unavailable for Excel Tables. Manual outline grouping and automatic subtotal creation are different operations.
6. You Selected Disconnected Rows
Create separate groups for each continuous section instead of selecting unrelated rows together.
Use Home > Format > Hide & Unhide > Unhide Rows to restore the missing rows.
8. Grouping Changes After Sorting
Sorting a grouped report can disrupt the relationship between detail rows and totals. Review the data and formulas after rearranging the worksheet.
Common Mistakes When Grouping Excel Rows
Avoid these errors when organizing spreadsheets:
- Including summary rows unnecessarily: Keep subtotal rows outside their inner detail groups when you want them visible.
- Grouping the wrong rows: Double-check row numbers before applying the Group command.
- Confusing grouping with filtering: Use filters when you need records matching certain criteria.
- Expecting Auto Outline to organize random categories: Prepare properly structured data first.
- Clearing an outline while rows are collapsed: Expand the details before removing all grouping.
- Ignoring formulas after sorting: Check that subtotals still refer to the correct records.
- Using grouping to protect private information: Grouping only changes visibility and isn’t a security feature.
These small checks can prevent unnecessary troubleshooting later.
Frequently Asked Questions
How do I group rows in Excel?
Select the row numbers, open the Data tab, and choose Group. Excel creates collapsible outline controls beside the selected rows.
What is the shortcut for grouping rows?
On Windows, press Alt + Shift + Right Arrow. On Mac, press Command + Shift + K.
How do I collapse grouped rows?
Click the minus (−) button beside the group or use an appropriate outline level button.
How do I expand grouped rows?
Click the plus (+) button to reveal the hidden detail rows.
Can I group multiple sections?
Yes. Select and group each continuous section separately.
Can I create nested row groups?
Yes. Create an outer group and then additional groups within its selected row range.
How many outline levels does Excel support?
Excel supports up to eight levels.
How do I group rows automatically?
Use Auto Outline with appropriately organized detail rows and summary formulas.
How do I group rows by category?
Arrange related category records together, add summaries where needed, and group their consecutive row ranges.
Worksheet protection, workbook restrictions, or selection problems may prevent grouping.
The outline symbols may be hidden in worksheet display settings, or the groups may have been removed.
How do I ungroup rows?
Select the grouped rows and choose Data > Ungroup.
How do I remove all grouping?
Open Data > Outline > Ungroup > Clear Outline.
Collapsed rows may remain hidden. Select the surrounding rows and use Unhide Rows.
Does grouping affect formulas?
Grouping doesn’t change ordinary SUM calculations or delete referenced data.
Can I group rows on Mac?
Yes. Use Data > Group or Command + Shift + K.
Can I group rows in Excel Online?
Yes. Excel for the web supports grouping and outlining through the Data tab.
What’s the difference between grouping and hiding rows?
Grouping creates reusable expand-and-collapse controls. Hiding conceals selected rows without creating an outline.
Conclusion
Grouping rows in Excel makes detailed reports easier to read without removing important information. Select the rows, choose Data > Group, and use the plus and minus buttons to control what appears.
Keyboard shortcuts save time, while nested groups help organize larger reports. When removing groups, check that every detail row is visible and your summary formulas still reference the correct data.
